Master contraction ranges and inside bar mechanics to spot institutional buildup before explosive moves. Learn strict breakout confirmation rules and filter out false breakouts to preserve capital in choppy market environments.
Contraction & Breakouts
Categorize market scenarios into objective setups to eliminate subjective emotional guesswork. Execute high-conviction A+ setups with full planned position size, scale down on B+ trades, and enforce cash discipline during No-Setup phases.
Setup Grading Filter
Detect institutional exhaustion volume spikes at extreme price points to identify genuine trend reversals. Differentiate between climactic stopping volume and trend continuation to capture asymmetric reversal swings.
Volume Climax & Reversals
Map market auction structures through dynamic channel analysis, higher-low progressions, and trend-line slope shifts. Recognize when a trend is gaining institutional momentum versus when it is exhausted and ripe for a liquidity sweep.
Auction Structure & Slope
Decode buyer and seller aggression within individual candlestick wicks to uncover hidden absorption. Learn how long upper and lower wicks signal algorithmic stop runs, trapped retail traders, and high-probability reversal confirmations.
Wick Absorption Dynamics
Identify 3-candle algorithmic price imbalances created by institutional market orders that leave unfilled liquidity. Learn how smart money algorithms return to rebalance these zones before resuming the dominant market trend.
Smart Money Imbalances
Implement Sandeep Rajput's structured 3-step formula: Displacement, Imbalance Creation, and Retest Confirmation. Enter high-probability trades with precise invalidation points and eliminate premature entries into choppy consolidation zones.
3-Step Execution Model
Utilize Central Pivot Range (CPR) width to forecast whether the trading session will be trending or rangebound. Track virgin CPR magnet levels and multi-pivot confluences used by institutional algorithms as benchmark execution targets.
CPR Width & Magnet Levels
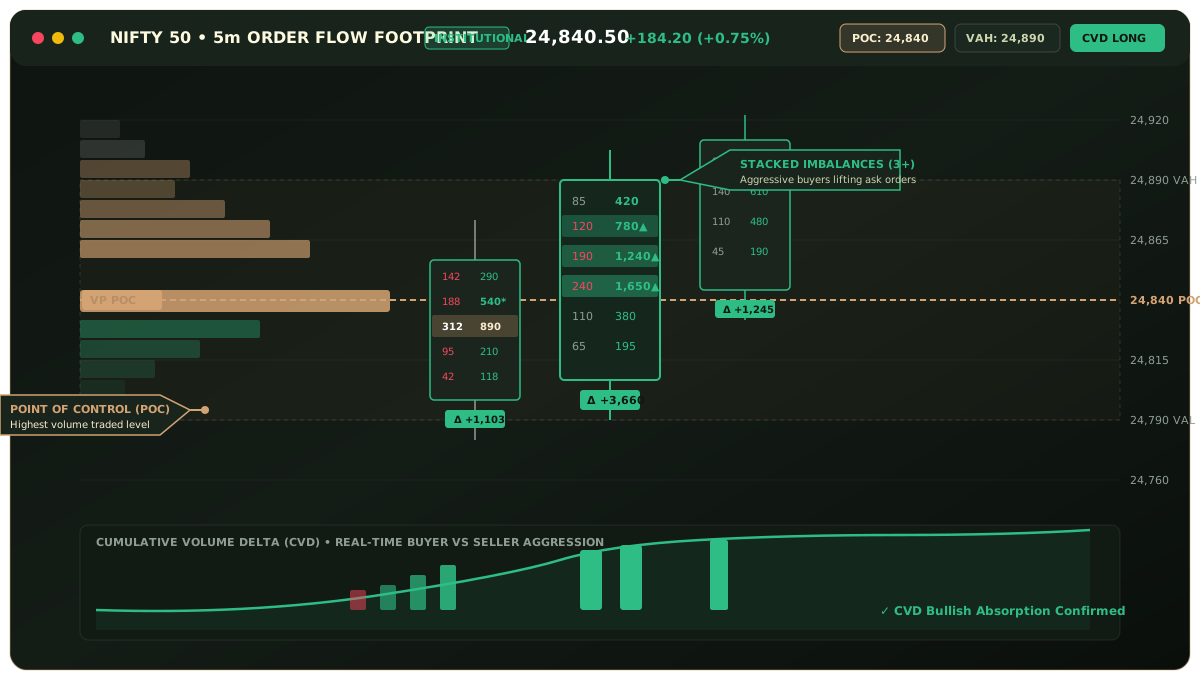
Track real-time buying versus selling pressure by analyzing executed market orders on the bid and ask. Spot delta divergence—where price prints higher highs while CVD fails—to anticipate institutional exhaustion before the turn.
CVD Delta Divergence
Master standard, Fibonacci, and Camarilla pivot frameworks to calculate objective daily support and resistance levels. Combine pivot reactions with candlestick confirmation to execute precision entries with tight, math-backed stop losses.
Camarilla & Fibonacci Pivots
Analyze horizontal volume distribution across daily and weekly sessions to identify the Point of Control (POC). Understand the Value Area (VAH and VAL) to know whether institutions are accepting current prices or seeking price discovery.
POC & Value Area Analysis
Apply volume profile tools to custom consolidation ranges and specific impulse legs to pinpoint institutional accumulation. Target high-probability entries at low-volume nodes and value area boundaries with asymmetric reward potential.
Custom Consolidation Auctions
Look inside the candlestick using footprint cluster charts to see executed order volumes at every price tick. Detect stacked buying or selling imbalances, trapped traders, and passive absorption without relying on lagging indicators.
Bid-Ask Cluster Ladders
Implement the mandatory 1% maximum capital risk rule and 2-trade daily ceiling to eliminate catastrophic drawdowns. Master position sizing formulas, drawdown circuit breakers, and emotional detachment to build compounding long-term consistency.
1% Risk Rule & Psychology